Monitor Tunnel Status, Latency, Traffic and Logs
Version and screenshots
This guide describes the current source version. Published installers may have fewer features; check your build against the release notes. Screenshots use demonstration data and a Pro example state.
A green connection status is useful, but it does not prove that every visitor can use your service. Troubleshooting becomes easier when you separate the local origin, provider connection and final access path.
Before you start
Know the expected local or remote destination, its protocol, and the account or server used by the tunnel. Have one real application request ready: an HTTP page, a database connection or another protocol-appropriate check.
Follow a three-layer check
| Layer | What to verify | A common failure |
|---|---|---|
| Origin | The service responds at the configured host and port | Wrong port or stopped process |
| Tunnel | SSH connects or the provider confirms hosting/registration | Expired login, missing credentials or rejected proxy |
| Visitor access | The intended client reaches the published route | DNS, firewall or authentication requirement |
For SSH local forwarding, the destination is reached from the SSH server, so the server's 127.0.0.1 is different from your laptop's. For Dev Tunnel, Cloudflare or FRP, check the configured local origin before diagnosing the public URL.
Inspect the desktop views
- Open Overview for aggregate connection information, current activity and traffic.
- Open Tunnels to inspect the affected entry's state and available latency or origin indicators.
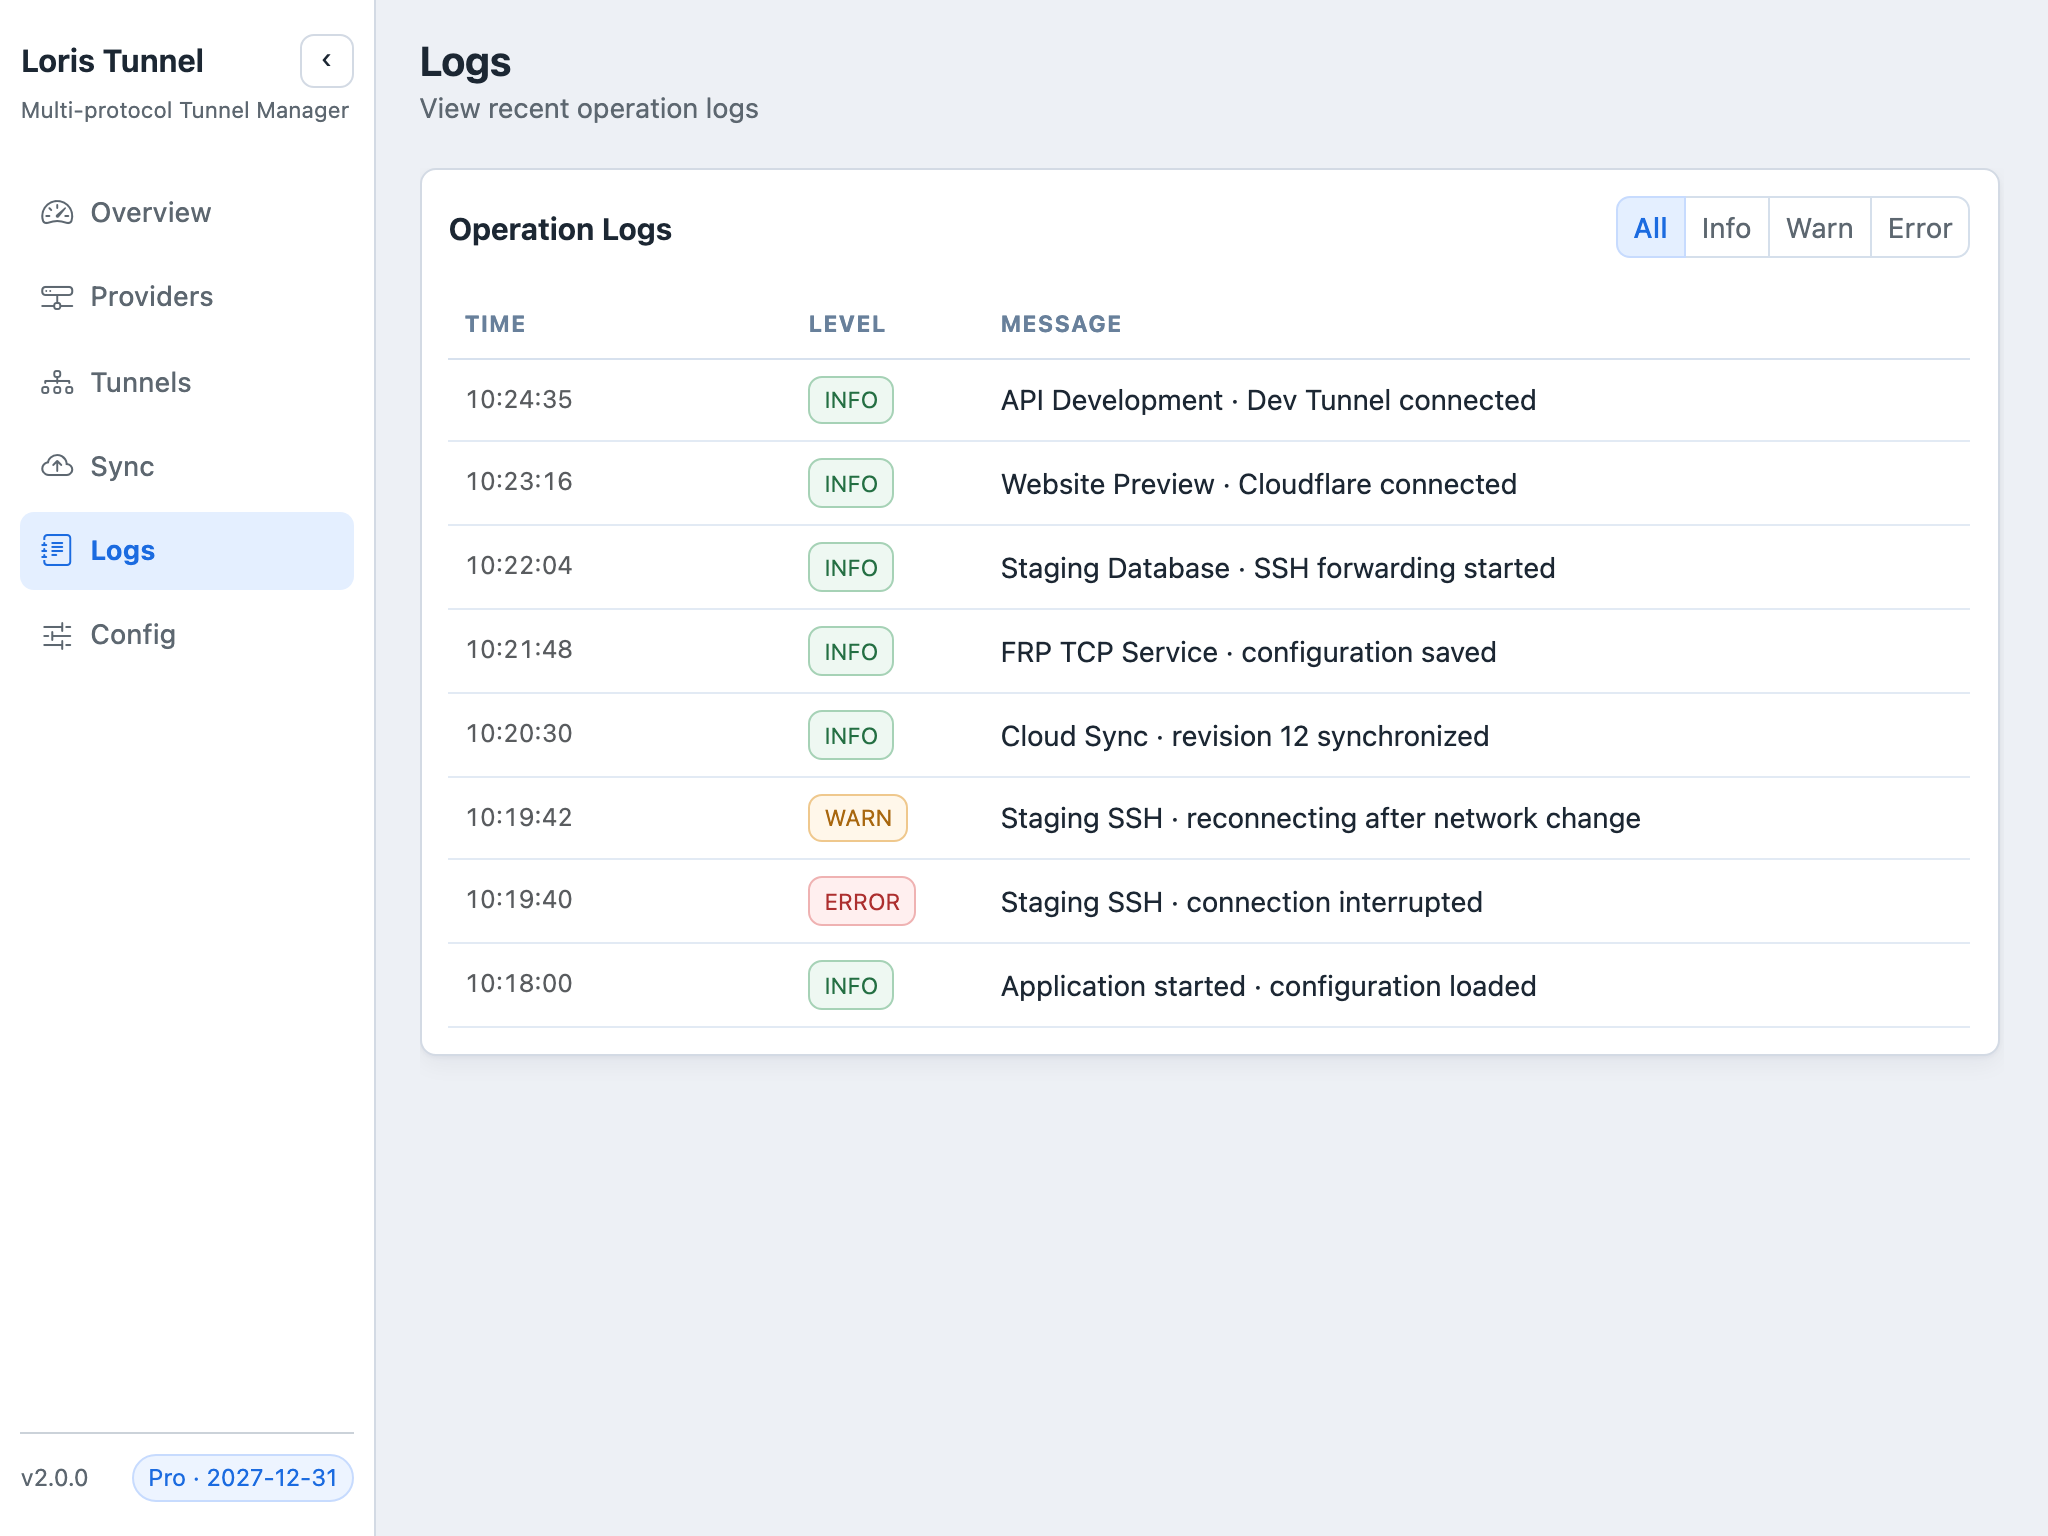
- Open Logs and locate the most recent warning or error associated with that connection.
- Use the corresponding Providers page to check CLI availability, sign-in, authorization or server configuration.
- Retry only after correcting the failing layer, then make a real request through the route.
Metrics depend on the provider. Do not interpret an absent traffic counter as proof of no traffic, or treat an SSH latency measurement and an HTTP endpoint probe as the same measurement.
Interpret provider-specific signals
SSH latency and route choice
Latency testing helps compare SSH paths and jump hosts. A fast SSH handshake does not prove that a database or web service at the forwarded destination is accepting connections. Check that service separately and use connection tests when creating or editing the route.
Private Dev Tunnel access
A private endpoint requires authentication. Its public probe can report that authorization is required rather than showing a normal anonymous HTTP result. Test with an authorized browser or intended client.
FRP registration
Loris waits for the client management API to confirm registration before reporting running. Local origin reachability is separate, and public DNS and server firewall rules must still be correct.
Cloudflare hostnames
Check zone authorization, local named-tunnel credentials, DNS routing and the origin protocol. A saved public hostname is only configuration until a running tunnel and a real request confirm it.
Verify recovery
After fixing the origin or credentials, start the tunnel and watch for a stable runtime state. Confirm that the intended application request succeeds, then inspect the logs for recurring errors. For a temporary network interruption, check that automatic reconnection resumes the same useful application path.
Common questions
Can an address preview be used as a health check?
No. It can be displayed before the endpoint is reachable. Test the reported running address from the intended client.
Does zero traffic mean my connection failed?
Not necessarily. The application may be idle or that provider may not expose the same traffic accounting. Use a real request and the provider's status together.
What should I include in a support report?
Include the app version, provider, expected route and relevant error text. Remove passwords, tokens, private keys and any sensitive host details before sharing logs or screenshots.